

Views: 0 Author: Site Editor Publish Time: 2026-06-25 Origin: Site


Asking a simple question about a cell's output reveals a hidden world of complexity. A single unit does not deliver one static number forever. Instead, it operates across a highly dynamic curve. Chemistry, current state of charge (SoC), and real-time load demand all heavily influence this metric. Misunderstanding these basic parameters creates massive engineering headaches. Confusing a nominal rating for a peak or absolute cut-off limit often leads to severe design errors. It results in mismatched system components. It triggers unexpected Battery Management System (BMS) shutdowns during peak operations. In worst-case scenarios, poor integration causes premature hardware failure. Our objective here is clear, actionable, and vital for success. We will equip engineers, system integrators, and procurement teams with a solid technical baseline. You will learn to specify the correct internal chemistry confidently. You will interpret complex discharge curves accurately. Furthermore, you will discover how to evaluate pack-level scaling for heavy commercial or industrial applications effectively. Mastering these concepts prevents costly deployment errors.
Engineers rely on a standard baseline to classify power sources across the industry. We call this the nominal voltage. For a standard Lithium-ion Battery, this baseline is typically 3.6V or 3.7V. It represents the average resting voltage observed during a complete standard discharge cycle. Manufacturers print this figure on spec sheets for easy categorization. However, this single number tells an incomplete technical story.
The actual operating range traces a distinct, predictable charge and discharge curve. When you fully charge a standard cell, the peak reaches exactly 4.2V. This is a strict, non-negotiable physical limit. Pushing charging currents beyond 4.2V causes internal metallic lithium plating. It also creates severe thermal risks. Conversely, the absolute cut-off sits between 2.5V and 3.0V. The protection board intervenes here to halt the discharge process entirely. Draining the unit further causes irreversible internal structural degradation. You permanently lose usable energy capacity.
Voltage sag adds another critical layer of dynamic behavior. When you apply a heavy load, the output drops momentarily. High discharge currents, known as high C-rates, pull the real-time output down rapidly. Temperature also plays a huge role here. Cold weather increases internal resistance, exacerbating the sag effect. System designers must account for this sudden dip. Failing to calculate sag triggers premature low-voltage disconnects. Your equipment might shut down abruptly despite having plenty of remaining capacity in the tank. We always recommend testing under maximum expected loads.
Cathode chemistry strictly dictates the exact limits of any cell. You cannot alter these fundamental physical constraints through clever software. Choosing the correct chemistry properly aligns the power profile directly to your specific application.
Let us deeply explore the primary chemistries shaping modern energy storage deployments:
We summarize these crucial operational limits in the reference table below:
| Chemistry | Nominal Voltage | Peak Voltage | Discharge Curve Profile | Ideal Application |
|---|---|---|---|---|
| NMC / NCA | 3.6V - 3.7V | 4.2V | Sloping / Linear | EVs, portable electronics, drones |
| LFP | 3.2V | 3.65V | Very Flat / Stable | Solar, UPS, heavy machinery |
| LTO | 2.4V | 2.85V | Sloping | Rapid charge networks, extreme cold |
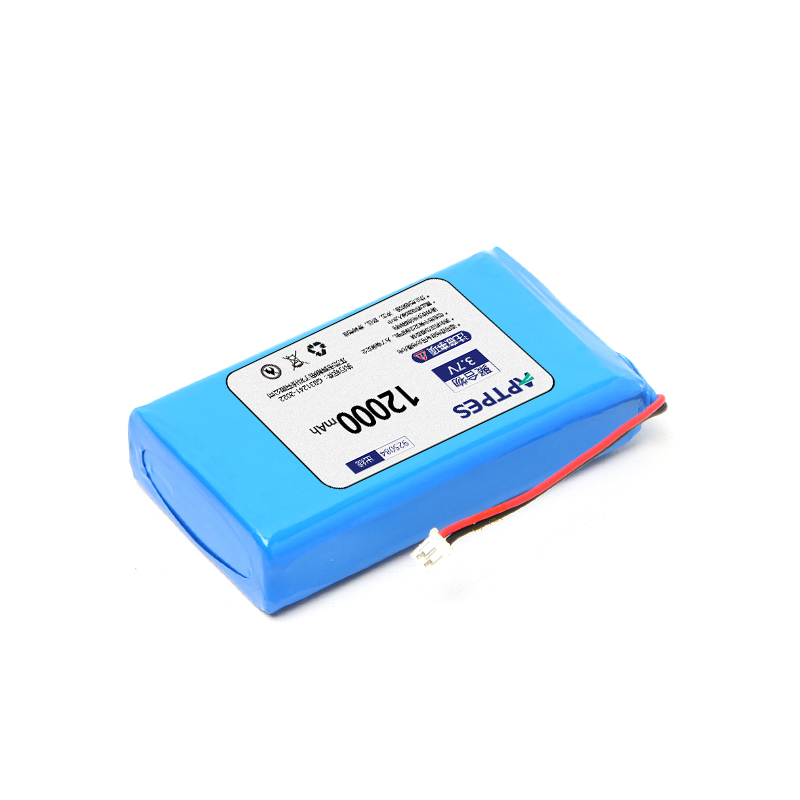
Individual units rarely provide enough raw power for large commercial equipment. You must wire them together carefully to build functional, high-capacity packs. Understanding series and parallel connections forms the bedrock of pack engineering.
We use two distinct configuration strategies to build larger arrays:
You must precisely map these physical configurations to standard commercial requirements. Consider the ubiquitous 12V system architecture used globally. Many designers utilize a 3S NMC pack (11.1V) or a 4S LFP pack (12.8V). A 4S LFP configuration acts as the vastly superior drop-in replacement for traditional 12V lead-acid units. The 12.8V resting state closely mirrors old lead-acid profiles. This exact matching prevents delicate equipment from malfunctioning. It ensures legacy inverters recognize the power source correctly.
Scaling up further requires robust 24V and 48V systems. Engineers typically build these using dense 8S or 16S LFP configurations. We regularly deploy these massive arrays in telecom towers, recreational vehicles, and enterprise backup grids. Pushing toward higher numbers yields massive electrical efficiency gains. You can drastically reduce heavy copper cable gauge size. You also minimize valuable energy lost as heat during long-distance transmission. Proper scaling requires heavy-duty busbars to handle the current without creating electrical bottlenecks.
Lithium chemistry provides incredible energy density. However, these individual units completely lack the ability to self-regulate. You absolutely must implement a dedicated Battery Management System (BMS). A reliable BMS actively monitors real-time parameters at the individual unit level. It constantly measures temperatures and current flow. It acts as the ultimate digital safety firewall.
Let us closely examine the severe physical risks of poor management:
Global safety certifications heavily scrutinize this regulatory hardware. Recognized testing standards like UL 1642, UL 1973, and UN38.3 evaluate systems relentlessly. Independent evaluators look closely at the protective board. They verify its ability to maintain safe thresholds under extreme abuse conditions like short circuits or crushes. You should always demand compliance-grade safety verification for any large-scale deployment.
When designing a robust Lithium-ion Battery system, never treat the BMS as an optional accessory. It remains non-negotiable. Bypassing the BMS for direct power draw voids warranties and guarantees eventual failure.
Selecting a reliable vendor requires strict technical due diligence from your team. You must read far beyond the glossy marketing brochures. Focus intently on the detailed engineering data sheets. Look actively for precise upper and lower cut-off limits. Verify the continuous discharge ratings against your actual real-world hardware load.
We highly recommend evaluating potential vendors using a structured, rigorous criteria chart:
| Evaluation Parameter | What to Look For in Data Sheets | Why It Matters for Integration |
|---|---|---|
| BMS Parameter Tuning | Fully adjustable low-voltage disconnect software. | Ensures perfect matching with existing legacy inverters or sensitive motor controllers. |
| Precise Hardware Cut-offs | Clearly stated maximum and minimum limits per cell. | Prevents accidental triggering of hardware safety shutdowns during routine operation. |
| Accurate Discharge Ratings | Clear distinction between continuous vs peak C-rates. | Guarantees the pack handles your specific transient motor loads without experiencing severe sag. |
| Thermal Derating Data | Charts showing output reduction in extreme heat. | Ensures system reliability if deployed in harsh outdoor or unconditioned environments. |
Ensure the chosen vendor allows deep parameter customization. You might frequently need to tune specific digital thresholds. Aligning the low-voltage disconnect settings seamlessly with your existing hardware prevents frustrating, random system dropouts.
Finally, demand total transparency regarding warranties and expected cycle life. Ask vendors for detailed degradation curves. These engineering charts show exactly how capacity holds up over 2,000 or more demanding cycles. Make sure they specify the exact Depth of Discharge (DoD) used during their lab testing. A pack rated for 5,000 cycles at 50% DoD performs very differently than one rated at 100% DoD. Understanding these nuances protects your investment.
Evaluating modern power systems requires a firm grasp of underlying chemistry and architecture. You now understand exactly how operational limits directly impact real-world performance.
A: You are seeing the resting voltage, not the nominal rating. A fully charged 12V LFP (4S) battery typically rests between 13.3V and 13.6V when disconnected from a load. This is entirely normal. It simply indicates a healthy, fully saturated state of charge.
A: The 11.1V rating refers to a 3-series (3S) NMC pack (3 x 3.7V cells). Conversely, "12V" in lithium terms usually refers to a 4-series (4S) LFP pack (4 x 3.2V cells = 12.8V). The chemistry and cell count differ, making them suited for entirely different applications.
A: The absolute cut-off usually sits between 2.5V and 3.0V, depending strictly on the manufacturer's specifications. You should never manually drain cells below the BMS cut-off. Pushing past this limit causes irreversible internal structural damage and ruins the cell.
A: Yes. However, the discharge curve shape depends on the chemistry. NMC output drops steadily, making remaining capacity easy to read. LFP stays incredibly flat around 3.2V for most of its cycle, only dropping sharply at the very end.


